


Acorns
Invest spare change
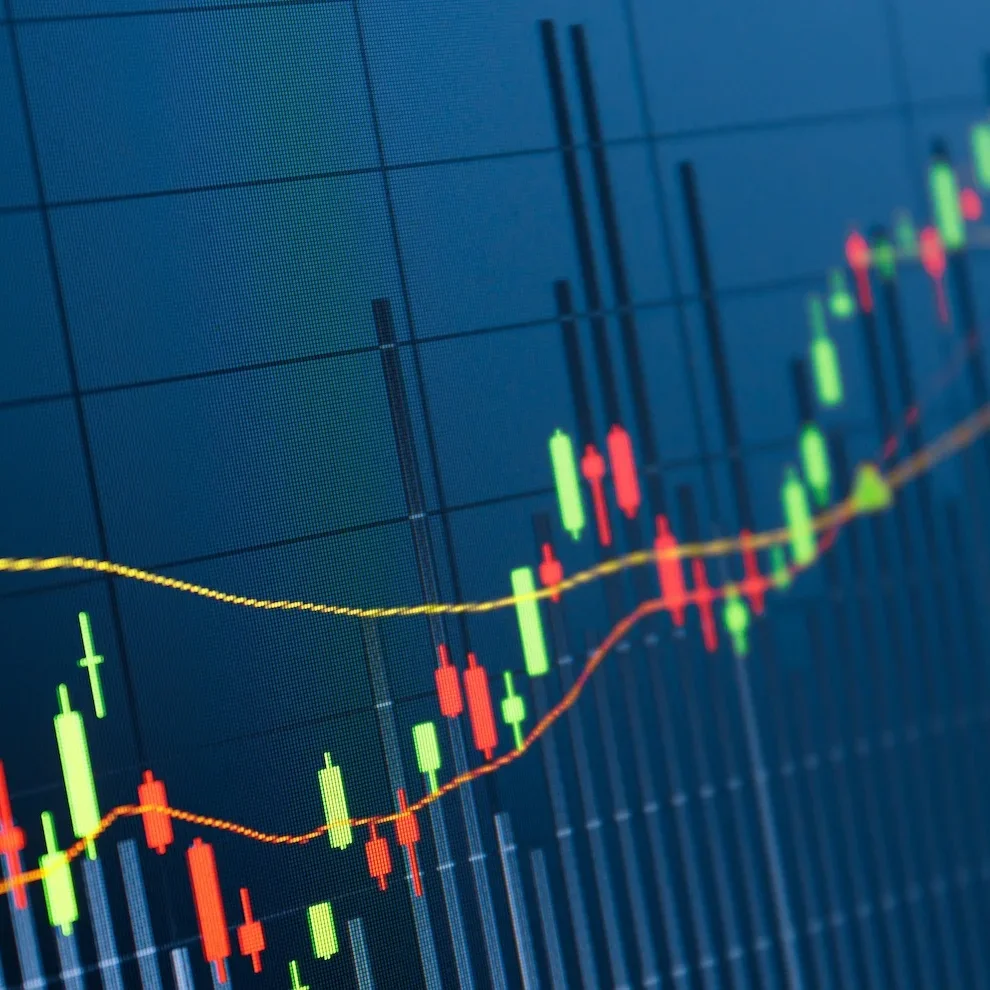
When you first started paying attention to financial news, you probably realized pretty quickly that experts and the media tend to measure our economy in terms of indexes: The Dow, for example, may be up 2 percent today, or the S&P 500 may have fallen 30 points.
These indexes are slices of the economy that group together hundreds (or thousands) of companies and help us understand how specific sectors of the stock market are performing. Experts often use the big ones, like the S&P 500 or the Dow Jones Industrial Average, as shorthand for how the entire economy is performing.
This index-centric mindset carries over to investing, leading people to gauge the performance of their investments against that of a broad index, like the S&P 500. While the S&P and Dow are two of the biggest names out there when it comes to these investing benchmarks, there are benchmarks for more than just the larger U.S. economy, and they set the standard for everything from small cap to bond funds. Even actively managed funds are compared against a benchmark index to determine if their management is providing better returns than a blind investment in the overall market itself.
Actively managed funds are primarily mutual funds that, unlike passive funds, are professionally managed. This means a person (or team of people) scours industry news, global trends, and thousands of reports to determine what individual companies or bonds to invest in.
Passive funds, like index funds, on the other hand, are pretty hands-off investments. While there are still people who monitor the funds, they aren’t making choices on what companies’ stocks to include because the fund’s goal is to emulate the performance of an index. Because of this, index funds will almost never outperform the market.
The difference in involvement is the primary reason why actively managed funds have higher expense ratios, or the percentage of your money that goes to operating costs instead of being invested. In 2018, the average expense ratio for passive funds was 0.15 percent, compared to 0.67 percent for actively managed funds, according to Morningstar. That’s a difference of about $5 a year for every $1,000 you invest. While that might not seem like a lot, it can really add up over time. Over 30 years, assuming you get 8 percent returns and invest an additional $1,000 a year, investing in the average actively managed fund would cost you $11,000 more than investing in its low-cost passive counterpart.
You might think actively managed funds might be worth the price if their performance justified their comparably higher costs. But historically, actively managed funds have actually failed to live up to their benchmarks, meaning by extension that active funds have underperformed those that are passively managed.
In 2018, 64 percent of active funds’ performance lagged behind their S&P 500 benchmark for that year, and things only grow bleaker when looking further back. When examining average annual performance over the past 15 years, nearly 92 percent of actively managed funds fall short of their benchmark, according to S&P Dow Jones Indices.
This means that while select actively managed funds may outperform their benchmarks (and their related index funds) over the short term, less than 10 percent manage to do so successfully over the long term. Though it’s possible you may be able to pick an actively managed fund that outperforms its benchmark, the odds aren’t in the average investor’s favor and decrease every subsequent year.
In fact, business magnate Warren Buffett infamously won a $1 million bet by investing in a standard S&P 500 fund against a hedge fund manager’s top choices. After a decade, Buffett’s index fund had outperformed its actively managed counterpart almost four times over.
During the course of his bet, Buffett’s S&P 500 fund averaged 9.45 percent gains, with dividends reinvested, and that level of performance isn’t uncommon for the benchmark index. Over the past century, the S&P 500 has seen average annual returns of just over 10 percent. Keep in mind that during that century, there have been down periods when returns were less, like the Great Depression and Great Recession of 2008, but the overall economy (and its benchmark indexes) have historically recovered and grown after each.
Even if you invest in an S&P 500 fund, though, you may not see quite the performance of the benchmark. That’s because it costs money to run even a passive fund (think trading fees and the salary of the person making those trades to keep the fund in line with the index). But index funds generally offer the cheapest, most efficient way to match the overall market’s performance.
While it can seem like your portfolio is falling short when it doesn’t see a 10 percent return in a given year or the numbers talked about on the nightly news, there are a couple of things to keep in mind:
Some years it may be exactly 10 percent and others it may be more or less. In 2019, for example, it’s currently up about 16 percent, but that’s after starting the year down pretty substantially from 2018’s highs. What’s important to remember is that the S&P 500 has offered significant returns for investors over the long term.
In fact, it may contain a mix of small- and large-cap, domestic and international, developed and emerging markets funds. This kind of diversification aims to give you a steadier ride than if you invested in any one fund alone. When domestic stocks may be down, international stocks may be up, helping your portfolio maintain its value and grow consistently over time. Your portfolio composition also may include a greater percentage of bond funds, which have historically offered smaller (but more stable) returns, depending on how much risk you’re willing to take on or your investing timeline.
Benchmarks provide a good way of measuring the overall health of your investments’ performance, particularly if you’re investing in actively managed funds that may be costing you substantially more than index funds offering similar or superior performance. While the S&P 500 and Dow don’t include representation from every company in the United States, they do provide a cross section of major stocks influencing the economy at large, and seeking to beat these benchmarks’ performance is extremely hard to do consistently over the long term.
This material has been presented for informational and educational purposes only. The views expressed in the articles above are generalized and may not be appropriate for all investors. The information contained in this article should not be construed as, and may not be used in connection with, an offer to sell, or a solicitation of an offer to buy or hold, an interest in any security or investment product. There is no guarantee that past performance will recur or result in a positive outcome. Carefully consider your financial situation, including investment objective, time horizon, risk tolerance, and fees prior to making any investment decisions. No level of diversification or asset allocation can ensure profits or guarantee against losses. Article contributors are not affiliated with Acorns Advisers, LLC. and do not provide investment advice to Acorns’ clients. Acorns is not engaged in rendering tax, legal or accounting advice. Please consult a qualified professional for this type of service.
John Schmidt is a senior writer at Acorns, covering a variety of personal finance topics.